
Making virtual imaging a reality
The leading US producer of
OLED Microdisplays
The OLED-XL™ Advantage
![]()
ABOUT eMagin
Founded in 2000, we are the leading manufacturer of active-matrix Organic LED (AM-OLED) Microdisplays on Silicon. Our displays provide image performance surpassing LCD technologies and are designed and manufactured in the U.S.A.
![]()
PRODUCTS
eMagin OLED Microdisplays offer solutions for military, medical, commercial/industrial and consumer markets including AR/VR applications.
![]()
MANUFACTURING OPERATIONS
Our industry leading OLED displays are produced in a state of the art manufacturing facility and cleanroom in New York State’s Hudson Valley.
![]()
TECHNOLOGY
With in-house R&D and Product Design groups, we are the leader in advancing OLED Microdisplay technology, featuring high brightness, low power and lightweight solutions. We offer superior resolutions and reliability across extended temperature ranges.
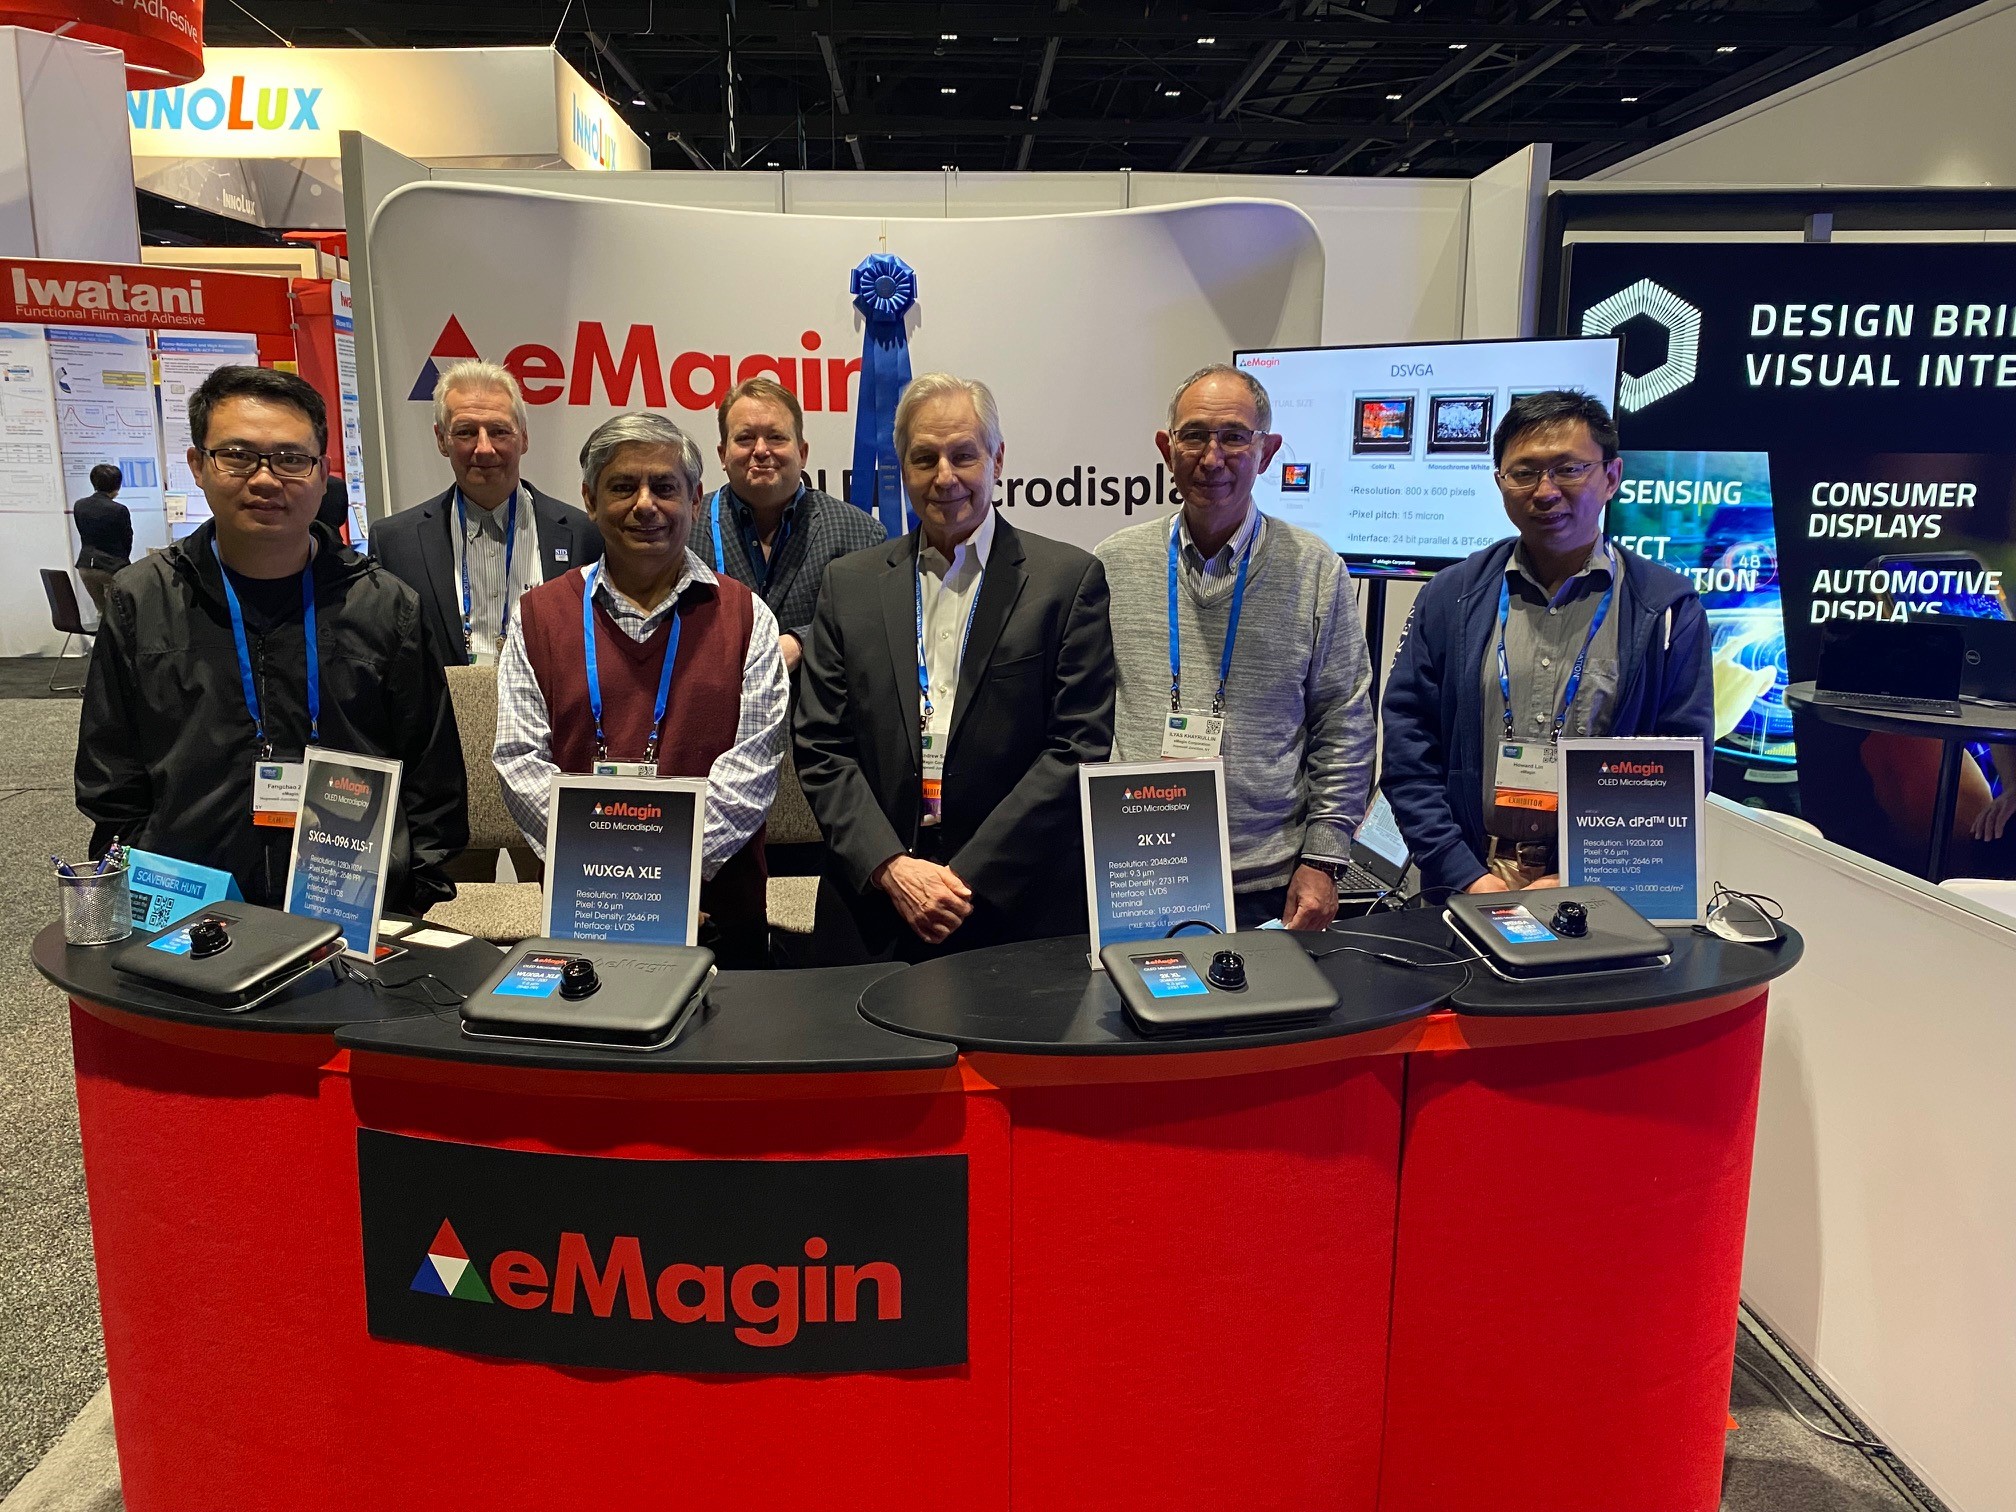
eMagin Wins People’s Choice Award
for Best New Technology at SID’s Display Week 2022

Markets
|
|
|
|


Press Releases
-
May 04, 2023
eMagin Demonstrates 15,000 cd/m2 Single-stack Full-color dPd™ OLED Microdisplay
Dec 15, 2022eMagin Receives $1.7M Order from Collins Aerospace
Dec 01, 2022eMagin Corporation to Exhibit at FLORetina ICOOR 2022 Conference
In the News
-
Jun 17, 2022
Printed Electronics Now