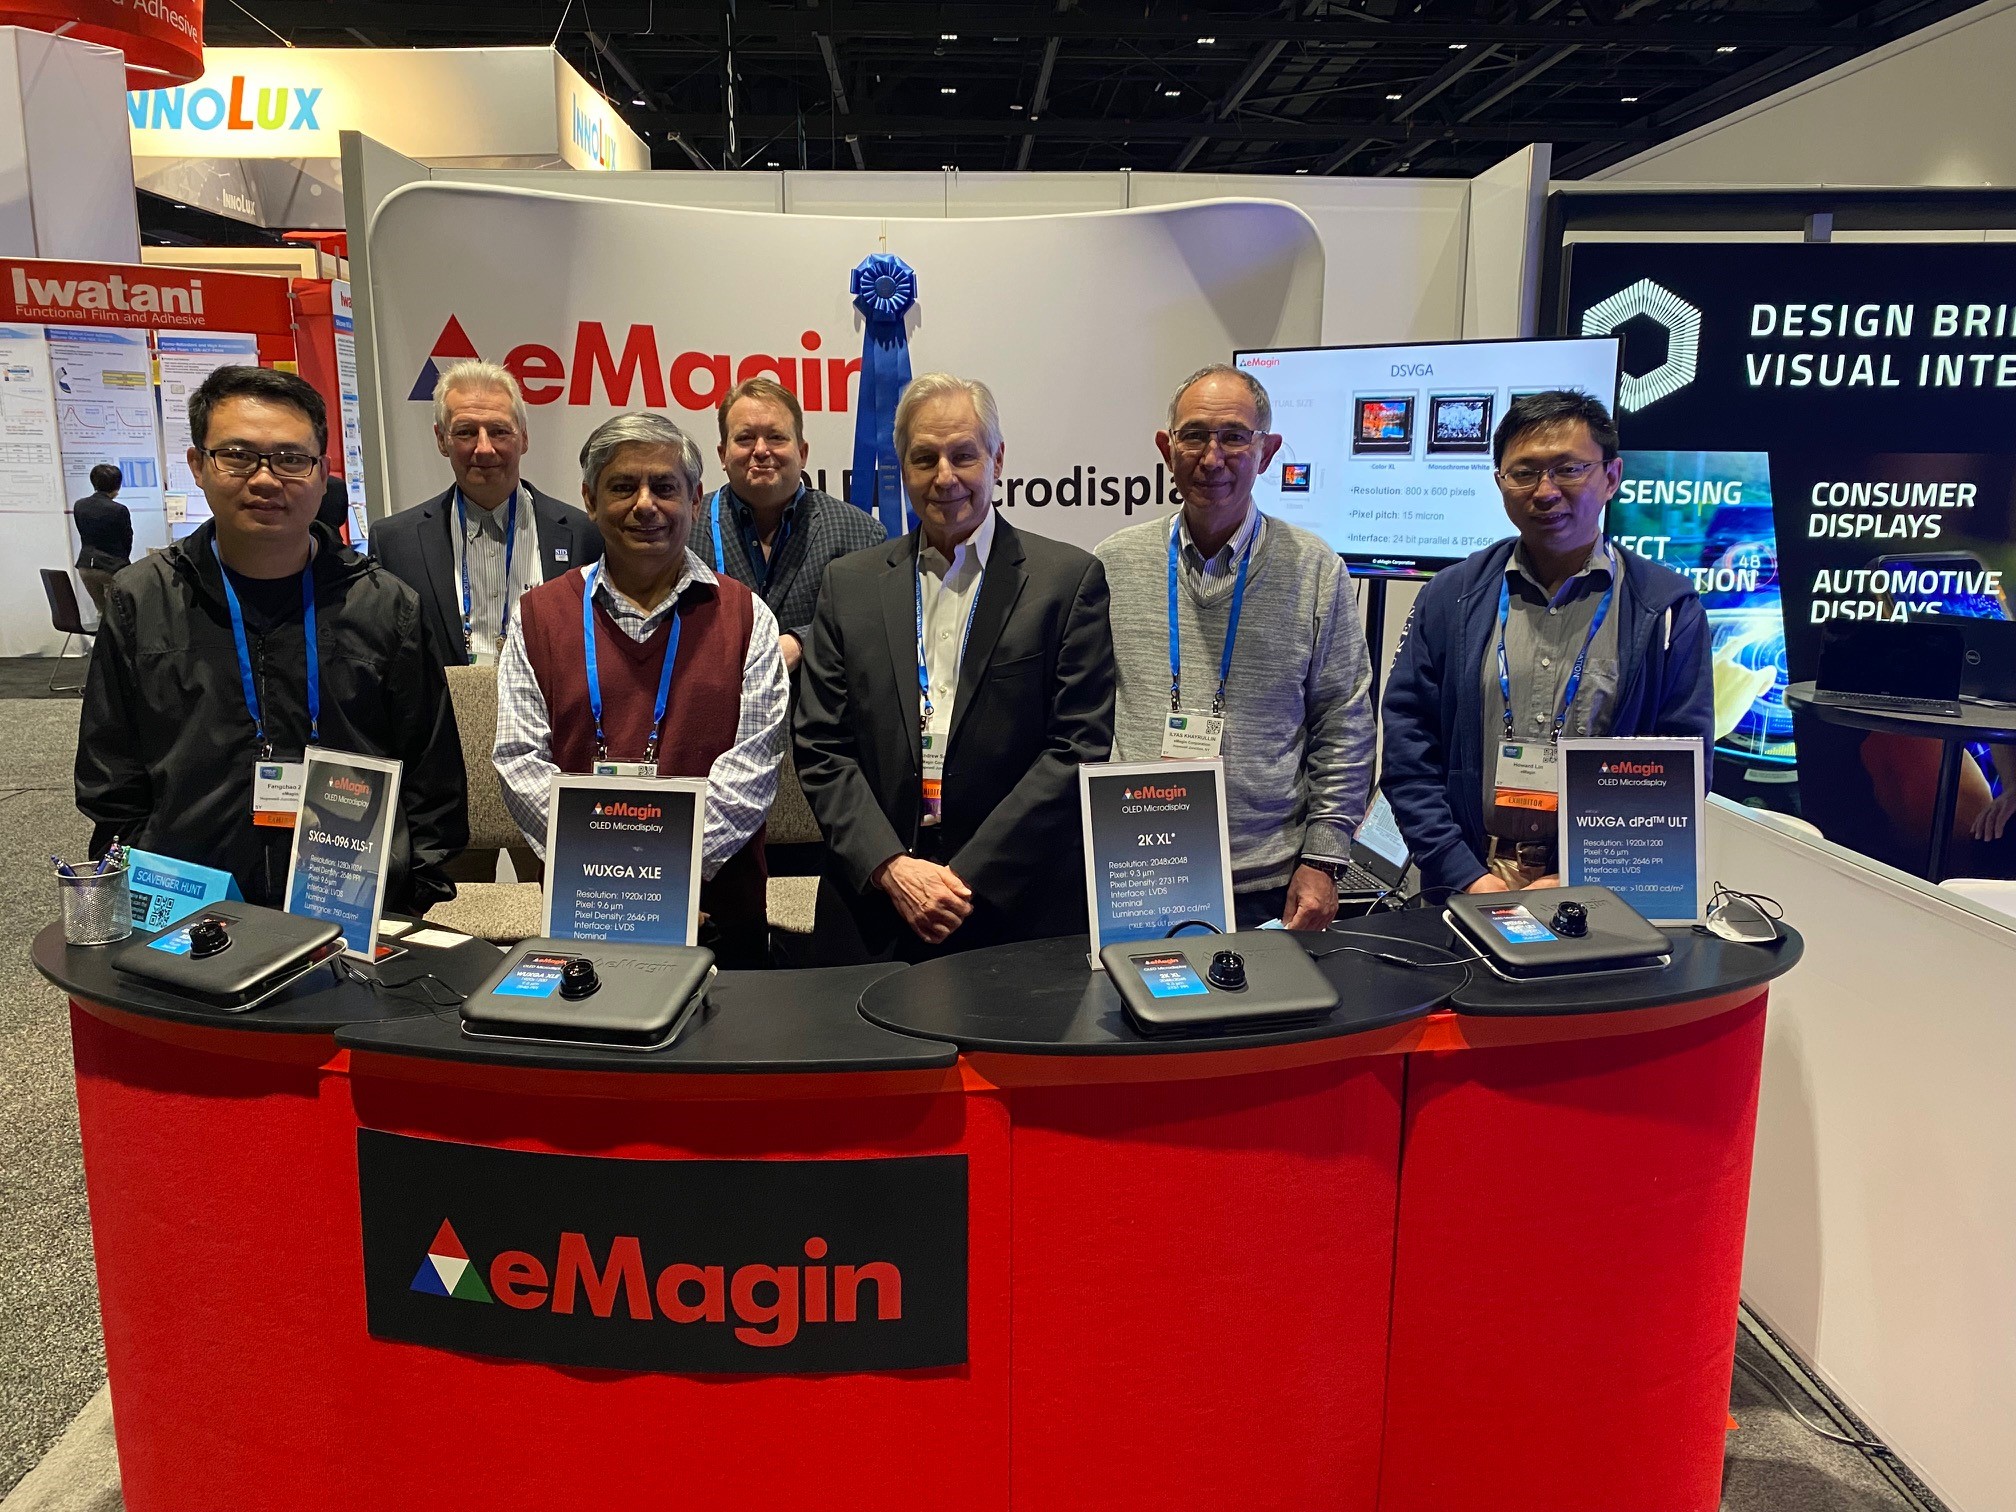
HOPEWELL JUNCTION, N.Y.--(BUSINESS WIRE)--Aug. 13, 2019-- eMagin Corporation, or the “Company”, (NYSE American: EMAN), a leader in the development, design and manufacture of Active Matrix OLED microdisplays for high resolution near-eye imaging products, today announced financial results and corporate highlights for the second quarter ended June 30, 2019.
“Our production during the second quarter continued to be impacted by manufacturing challenges and led to disappointing results for the Company. We have implemented several measures and are seeing yields and production volumes recovering,” stated Jeffrey Lucas, President and CFO.
“It is critical that we improve stability in our manufacturing processes with the goal of stemming operating losses and reaching a break-even financial position. We have made improving yields, increasing production volumes and fulfilling our customer orders the highest priorities throughout the Company. We are accelerating our ongoing efforts including several significant measures:
- Our R&D and manufacturing teams are collaborating closely to identify and resolve the production issues,
- We retained an engineer from our OLED deposition tool vendor to work with our staff to increase the throughput of this critical tool,
- We enhanced our equipment maintenance practices including staffing maintenance coverage during all shifts to minimize unscheduled downtime and improve machine performance, and
- On the cost front, we are taking further measures to reduce our expenses at the operating and administrative levels.
“While the benefits of these initiatives will require some time, we are already seeing progress. In the current quarter, we produced 25% more displays during the first month than we did in the first month of the previous quarter. Our production yields are beginning to recover and return to the upward trend we were achieving as part of our long-term yield improvement plan. We are seeing the impact of our cost control efforts in the reduction of our R&D and SG&A expenses both year-over-year and sequentially. We will continue to work aggressively to improve our operating performance and strengthen our financial position,” concluded Mr. Lucas.
“In the second quarter, demand for our products, particularly from military and aviation programs, both domestic and international, remained strong,” stated Andrew G. Sculley, CEO. “We continue to win new programs and support existing ones, many of which extend over multiple years. We delivered displays for the F-35 Lightning II helmet throughout the second quarter enabling helmets to be delivered for fleet testing. Engineering work on the improved OLED microdisplay for the helmets began in July in preparation for Low Rate Initial Production. We are also working with the two prime contractors on pre-production units for the ENVG Binocular program, which is anticipated to commence production in late 2019/early 2020 with an overall acquisition objective by the U.S. Army of over 108,000 systems. In addition, our presence in medical markets continues to grow as we received 12 orders from existing medical customers during the quarter. In total, during the second quarter of fiscal 2019, we received 98 orders, of which 13 were from new customers, and supplied products for 22 new programs. Our backlog of products scheduled for delivery through June 30, 2020, continues to be solid at $11.6 million, an increase of approximately $1.0 million over the backlog of $10.6 million at December 31, 2018.
“We are developing a new color display, the XLE, which is significantly brighter than our current displays. This microdisplay utilizes a new architecture in our existing OLED stack structure for greater efficiency and a longer lifetime and can be produced on our current equipment. We are targeting engineering samples in the fourth quarter. Initial customer reaction to the expected performance has been positive with substantial interest generated.
“Production of OLED microdisplays is complex and we are supported by a very talented team of engineers and production employees with substantial industry expertise. We are confident of our ability to continue the progress made on resolving our production issues,” concluded Mr. Sculley.
Quarter Results
Revenues for the second quarter of 2019 were $5.4 million, a decrease of $1.7 million from revenues of $7.1 million reported a year ago, and down sequentially by $0.7 million from the first quarter of 2019.
Product revenues were $5.0 million as compared to $6.2 million in the second quarter of 2019. On a sequential basis, product revenues fell 10% from the first quarter of 2019. The year-over-year decrease in product revenue was due primarily to display production related issues. Contract revenues totaled $0.4 million in the second quarter compared to $0.9 million in the same quarter of last year, reflecting less revenues from military and government-funded contracts.
Overall gross margin for the second quarter was 4% on gross profit of $0.2 million compared to a gross margin of 2% on gross profit of $0.1 million in the prior year period. Excluding a $2.7 million impairment charge related to the consumer night vision business, gross margin and gross profit for the second quarter of 2018 were 40% and $2.8 million, respectively. The decrease in gross profit and margin, excluding the impairment charge, was primarily due to the current quarter production issues and lower revenues in comparison to the year ago period.
Operating expenses for the second quarter of 2019, including R&D expenses, were $3.1 million as compared to $3.8 million in the second quarter of 2018. Operating expenses as a percentage of sales were 57% in the second quarter of 2019 compared to 53% a year ago. The decrease in operating expenses was due to lower SG&A expenses this period versus the year ago period which included spending on professional services, legal, and travel and other discretionary expenses. In addition, R&D expenses were lower in the second quarter, primarily reflecting a decrease in allocated production costs resulting from a lower level of internal R&D activity as we focused on fulfilling customer orders.
Operating loss for the second quarter was $2.9 million versus an operating loss of $3.6 million in the second quarter of last year. Excluding the charge related to the consumer night vision business inventory, operating loss for the second quarter of 2018 was $0.9 million. Net loss for the second quarter of 2019 was $2.3 million, or $0.05 per diluted share, compared to a net loss of $5.1 million, or $0.11 per diluted share, in the second quarter of 2018. The net loss included income related to the change in the fair value of the warrant liability of $0.5 million and a loss of $1.4 million, respectively, for the second quarters of 2019 and 2018.
As of June 30, 2019, the Company had cash and cash equivalents of $3.7 million, working capital of $8.3 million, and borrowing availability under the ABL facility of $1.0 million.
Conference Call Information
A conference call and live webcast will begin today at 9:00 am ET. An archive of the webcast will be available one hour after the live call through September 13, 2019. To access the live webcast or archive, please visit the Company’s website at ir.emagin.com or www.earnings.com.
About eMagin Corporation
A leader in OLED microdisplay technology, OLED microdisplay manufacturing know-how and mobile display systems, eMagin manufactures high-resolution OLED microdisplays and integrates them with magnifying optics to deliver virtual images comparable to large-screen computer and television displays in portable, low-power, lightweight personal displays. eMagin’s microdisplays provide near-eye imagery in a variety of products for military, industrial, medical and consumer applications. More information about eMagin is available at www.emagin.com.
Forward-Looking Statements
This press release contains forward-looking statements within the meaning of Section 27A of the Securities Act of 1933 and Section 21E of the Securities Exchange Act of 1934, including those regarding eMagin Corporation’s expectations, intentions, strategies and beliefs pertaining to future events or future financial performance. Actual events or results may differ materially from those in the forward-looking statements as a result of various important factors, including those described in the Company’s most recent filings with the SEC. For a more complete description of the risks that could cause our actual results to differ from our current expectations, please see the section entitled “Risk Factors” in eMagin’s Annual Report on Form 10-K for the fiscal year ended December 31, 2018.
Non-GAAP Financial Measures
To supplement the Company’s consolidated financial statements presented on a GAAP basis, the Company has provided non-GAAP financial information, namely earnings before interest, taxes, depreciation and amortization, and non-cash compensation expense (“Adjusted EBITDA”). The Company’s management believes that this non-GAAP measure provides investors with a better understanding of how the results relate to the Company’s historical performance. The additional adjusted information is not meant to be considered in isolation or as a substitute for GAAP financial statements. Management believes that these adjusted measures reflect the essential operating activities of the Company. A reconciliation of non-GAAP financial information appears below.
EMAGIN CORPORATION | ||||||||||||||||
CONSOLIDATED STATEMENTS OF OPERATIONS | ||||||||||||||||
(in thousands, except share and per share data) | ||||||||||||||||
(unaudited) | ||||||||||||||||
Three Months Ended |
Six Months Ended |
|||||||||||||||
June 30, |
June 30, |
|||||||||||||||
|
2019 |
|
|
2018 |
|
|
2019 |
|
|
2018 |
|
|||||
Revenues: | ||||||||||||||||
Product |
$ |
4,958 |
|
$ |
6,216 |
|
$ |
10,465 |
|
$ |
12,079 |
|
||||
Contract |
|
403 |
|
|
850 |
|
|
1,008 |
|
|
1,854 |
|
||||
Total revenues, net |
|
5,361 |
|
|
7,066 |
|
|
11,473 |
|
|
13,933 |
|
||||
Cost of revenues: | ||||||||||||||||
Product |
|
4,898 |
|
|
3,971 |
|
|
9,324 |
|
|
8,330 |
|
||||
Contract |
|
238 |
|
|
299 |
|
|
588 |
|
|
827 |
|
||||
Impairment of Consumer Night Vision inventory |
— |
|
2,690 |
|
— |
|
2,690 |
|
||||||||
Total cost of revenues |
|
5,136 |
|
|
6,960 |
|
|
9,912 |
|
|
11,847 |
|
||||
Gross profit |
|
225 |
|
|
106 |
|
|
1,561 |
|
|
2,086 |
|
||||
Operating expenses: | ||||||||||||||||
Research and development |
|
1,300 |
|
|
1,720 |
|
|
2,897 |
|
|
3,351 |
|
||||
Selling, general and administrative |
|
1,777 |
|
|
2,031 |
|
|
3,716 |
|
|
4,943 |
|
||||
Total operating expenses |
|
3,077 |
|
|
3,751 |
|
|
6,613 |
|
|
8,294 |
|
||||
Loss from operations |
|
(2,852 |
) |
|
(3,645 |
) |
|
(5,052 |
) |
|
(6,208 |
) |
||||
Other income (expense): | ||||||||||||||||
Change in fair value of common stock warrant liability |
|
536 |
|
|
(1,427 |
) |
|
1,330 |
|
|
(924 |
) |
||||
Interest expense, net |
|
(21 |
) |
|
(30 |
) |
|
(55 |
) |
|
(72 |
) |
||||
Other income, net |
— |
|
37 |
|
— |
|
58 |
|
||||||||
Total other expense |
|
515 |
|
|
(1,420 |
) |
|
1,275 |
|
|
(938 |
) |
||||
Loss before provision for income taxes |
|
(2,337 |
) |
|
(5,065 |
) |
|
(3,777 |
) |
|
(7,146 |
) |
||||
(Provision) benefit for income taxes |
— |
— |
— |
— |
||||||||||||
Net loss |
$ |
(2,337 |
) |
$ |
(5,065 |
) |
$ |
(3,777 |
) |
$ |
(7,146 |
) |
||||
Loss per share, basic and diluted |
$ |
(0.05 |
) |
$ |
(0.11 |
) |
$ |
(0.08 |
) |
$ |
(0.16 |
) |
||||
Weighted average number of shares outstanding: | ||||||||||||||||
Basic and Diluted | 48,817,940 | 45,111,273 | 46,979,505 | 43,691,117 |
EMAGIN CORPORATION | ||||||||
CONSOLIDATED BALANCE SHEETS | ||||||||
(in thousands, except share and per share data) | ||||||||
June 30 |
December 31, |
|||||||
|
2019 |
|
|
2018 |
|
|||
(unaudited) |
||||||||
ASSETS | ||||||||
Current assets: | ||||||||
Cash and cash equivalents |
$ |
3,705 |
|
$ |
3,359 |
|
||
Accounts receivable, net |
|
2,733 |
|
|
3,186 |
|
||
Unbilled accounts receivable |
|
21 |
|
|
224 |
|
||
Inventories |
|
8,368 |
|
|
8,582 |
|
||
Prepaid expenses and other current assets |
|
896 |
|
|
875 |
|
||
Total current assets |
|
15,723 |
|
|
16,226 |
|
||
Equipment, furniture and leasehold improvements, net |
|
8,785 |
|
|
8,921 |
|
||
Operating lease right- of- use assets |
|
3,953 |
|
— |
||||
Intangibles and other assets |
|
200 |
|
|
269 |
|
||
Total assets |
$ |
28,661 |
|
$ |
25,416 |
|
||
LIABILITIES AND SHAREHOLDERS’ EQUITY | ||||||||
Current liabilities: | ||||||||
Accounts payable |
$ |
1,856 |
|
$ |
2,024 |
|
||
Accrued compensation |
|
1,782 |
|
|
1,634 |
|
||
Revolving credit facility, net |
|
945 |
|
— |
||||
Finance lease liability - current portion |
|
15 |
|
— |
||||
Common stock warrant liability |
|
166 |
|
|
1,497 |
|
||
Other accrued expenses |
|
1,543 |
|
|
1,827 |
|
||
Deferred revenue |
|
133 |
|
|
38 |
|
||
Operating lease liability - current portion |
|
689 |
|
— |
||||
Other current liabilities |
|
320 |
|
|
427 |
|
||
Total current liabilities |
|
7,449 |
|
|
7,447 |
|
||
Finance lease liability-long term |
|
32 |
|
— |
||||
Operating lease liability-long term |
|
3,384 |
|
— |
||||
Total liabilities |
$ |
10,865 |
|
$ |
7,447 |
|
||
Commitments and contingencies (Note 8) | ||||||||
Shareholders’ equity: | ||||||||
Preferred stock, $.001 par value: authorized 10,000,000 shares: | ||||||||
Series B Convertible Preferred stock, (liquidation preference of $5,659) stated value $1,000 per share, $.001 par value: 10,000 shares designated and 5,659 issued and outstanding as of June 30, 2019 and December 31, 2018 |
— |
— |
||||||
Common stock, $.001 par value: authorized 200,000,000 shares, issued 49,325,839 shares, outstanding 49,171,773 shares as of June 30, 2019 and issued 45,323,339 shares, outstanding 45,161,273 shares as of December 31, 2018 |
|
49 |
|
|
45 |
|
||
Additional paid-in capital |
|
258,335 |
|
|
254,736 |
|
||
Accumulated deficit |
|
(240,088 |
) |
|
(236,312 |
) |
||
Treasury stock, 162,066 shares as of June 30, 2019 and December 31, 2018 |
|
(500 |
) |
|
(500 |
) |
||
Total shareholders’ equity |
|
17,796 |
|
|
17,969 |
|
||
Total liabilities and shareholders’ equity |
$ |
28,661 |
|
$ |
25,416 |
|
Non-GAAP Information | ||||||||||||||||
Three Months Ended |
Six Months Ended |
|||||||||||||||
June 30, |
June 30, |
|||||||||||||||
|
2019 |
|
2018 |
2019 |
2018 |
|||||||||||
Net income (loss) |
$ |
(2,337 |
) |
$ |
(5,065 |
) |
$ |
(3,777 |
) |
$ |
(7,146 |
) |
||||
Non-cash compensation |
|
97 |
|
130 | 290 | 335 | ||||||||||
Change in fair value of common stock warrant liability |
|
(536 |
) |
1,427 | (1,330 | ) | 924 | |||||||||
Depreciation and intangibles amortization expense |
|
500 |
|
482 | 987 | 950 | ||||||||||
Interest expense |
|
22 |
|
30 | 55 | 72 | ||||||||||
Provision for income taxes |
|
- |
|
- | - | - | ||||||||||
Adjusted EBITDA |
$ |
(2,254 |
) |
$ |
(2,996 |
) |
$ |
(3,775 |
) |
$ |
(4,865 |
) |
View source version on businesswire.com: https://www.businesswire.com/news/home/20190813005116/en/
Source: eMagin Corporation
eMagin Corporation
Jeffrey Lucas, President and Chief Financial Officer
845-838-7931
This email address is being protected from spambots. You need JavaScript enabled to view it.
Affinity Growth Advisors
Betsy Brod
212-661-2231
This email address is being protected from spambots. You need JavaScript enabled to view it.